There is a baffling phenomenon in contact centers that most contact center managers cannot explain, and, if you are still largely scoring QA manually, you might be familiar with it as well. You pull up your QA dashboard and everything looks fine. Scores are strong, agents are passing evaluations, and leadership is satisfied. But your CSAT numbers tell a different story — and you can't quite figure out why. If that tension sounds familiar, you're not dealing with a performance problem. You're dealing with a measurement problem.
In my work as an AI and Voice Analytics Consultant at MiaRec, I talk with contact centers every day that are experiencing this exact disconnect. And the discomfort it creates is real. How do you coach your agents to improve on something you can't clearly see? How do you explain to senior leadership why customer satisfaction isn't improving when, on paper, your team is doing everything right?
This article unpacks why that gap exists, what the research says about how widespread it is, and what a more complete picture of performance actually looks like — one that goes beyond the scorecard and into the actual experience your customers have. By the end of this article, you will not only know what this looks like in practice, but you will also be able to explain it to leadership and solve the root cause of the problem.
I recently hosted a webinar with Jordan Zivoder, Quantitative Research Lead and Analyst at CMP Research, on this topic. If you'd prefer to watch the full session, you can access it here.

Improving Customer Analytics and Insights is #1 Strategic Priority
The frustration contact center leaders feel about QA is not anecdotal. According to research conducted by CMP, improving customer analytics and insights has ranked as the #1 strategic priority for two consecutive years. That's not a coincidence. It reflects a widespread recognition that the data most organizations are working with isn't telling the full story.
Jordan Zivoder, Quantitative Research Lead and Analyst at CMP Research, shared these findings during our webinar. When we polled attendees — a room of contact center managers and directors — and asked how confident they were that their QA scores accurately reflect the true customer experience, the results were telling:
- The majority said they were only somewhat confident.
- The second most common response was not confident at all.
- Virtually no one said they were very confident.
That lack of confidence is well-founded. Zivoder shared that when CMP Research works with clients to run a simple statistical correlation between their QA scores and their CSAT data, a meaningful relationship is rarely found. The general threshold for a correlation worth paying attention to is 0.3 or above. Most organizations fall well below it.
In one case that Zivoder described, the correlation wasn't just weak — it was slightly negative. Agents with higher QA scores were, marginally, associated with lower customer satisfaction. Not because those agents were doing a bad job, but because the QA scorecard being used had no real statistical relationship to what customers actually valued.
That is a significant finding. And for organizations investing time, money, and management attention into QA programs, it raises an important question: If the score doesn't predict customer satisfaction, what exactly is it measuring?
What the Gap Looks Like in Practice
In my experience as a contact center manager and now working with contact centers, I've seen this play out repeatedly. During our webinar, I shared a real example from one of our customers' QA dashboards. The team filtered their calls to show every interaction where an agent had passed their internal QA evaluation — by their own standards, a good call — and then cross-referenced those calls with customer satisfaction outcomes.
The result: 31% of those passing calls ended with a dissatisfied or very dissatisfied customer. Nearly one in three calls that cleared the QA bar still resulted in a bad customer experience.
Two additional examples made the point even more clearly:
- An agent scored 92% on their QA evaluation. The customer left dissatisfied. The agent had been polite throughout, but struggled to clearly explain a pricing discrepancy — something the scorecard never directly asked about.
- Another agent scored 96% — near perfect. The customer was still dissatisfied, flagged as a likely detractor, and at risk of churning.
In both cases, the scorecard and the customer reality were different. And without anything beyond the QA score to look at, there was no way to know why — or even that a problem existed at all.
The Underlying Problem: Traditional QA Was Never Built to Measure Customer Experience
Traditional QA programs were built around human capacity. A QA analyst reviewing calls all day can only track so much. I know this firsthand because I worked as a QA analyst earlier in my career, and I can tell you that fatigue sets in fast, especially on calls that run 20 to 30 minutes. Listening to a full conversation and accurately evaluating every moment, every tone shift, every instance of empathy or friction — that's just not realistic at scale. So scorecards were simplified to match what a human reviewer could feasibly assess: discrete, observable moments.
Did the agent greet the caller? Did they confirm the customer's name? Did they offer a closing statement? These are checkbox questions because they are binary, easy to score, and consistent across reviewers. They work for compliance monitoring. But they are a proxy for the customer experience, not a measure of it.
What customers actually care about is harder to quantify. They care whether the agent was professional throughout the entire conversation, not just at the beginning. They care whether they felt heard, whether their issue was genuinely resolved, and whether the interaction required a lot of effort on their part. Those are the behaviors — empathy, communication, effective resolution — that research consistently shows drive satisfaction and retention.
As Zivoder pointed out during our session, those are also the behaviors that are most difficult for a human reviewer to assess consistently. And over time, the problem compounds. New leadership joins and adds items to the scorecard. Certain questions get weighted more heavily — often based on intuition rather than data. The score becomes, as Zivoder put it, "very noisy." It measures a lot of things, but the connection to what customers actually experience becomes thinner and thinner.
The result is a QA program that functions well as a compliance and process audit, but tells you very little about whether your customers are walking away satisfied, frustrated, or quietly planning to leave.
The Missing Layer: Measuring What Customers Actually Experience
Closing the gap between QA scores and customer experience requires adding a layer of measurement that traditional QA was never designed to provide — one that shifts the focus from agent behavior compliance to the actual customer experience.
Instead of asking Did the agent follow the script?, the more useful questions are:
- Was the customer satisfied with this interaction?
- Did they have to work hard to get the help they needed?
- Are they likely to recommend this company after this call?
- Based on how this call went, are they at risk of churning?
AI now makes it possible to score these dimensions — predicted CSAT, customer effort, NPS, and churn risk — across 100% of interactions, automatically, from the conversation transcript. The AI reviews the full context of each call with detailed instructions, then provides a score and — critically — an explanation. Not just dissatisfied, but why the customer was dissatisfied, grounded in what was actually said.
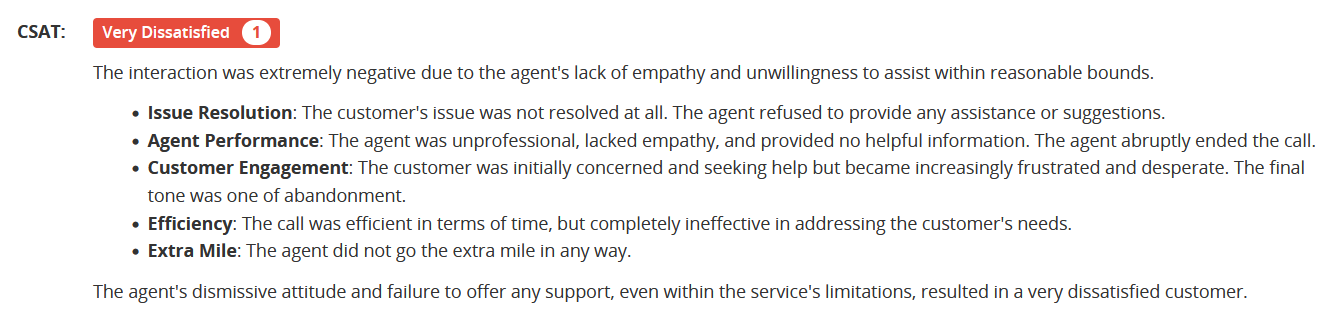
Image: Screenshot of the CSAT score and explanation of the score within a call detail screen in the MiaRec platform.
This matters for two reasons. The first is volume. Post-call surveys, the traditional mechanism for capturing customer experience data, yield response rates of around 5% on average — and the data that comes back is often skewed toward customers who were either very happy or very upset, and is frequently rushed through without genuine reflection. Contact centers are making decisions about their entire operation based on a thin, unrepresentative slice of feedback.
The second is specificity. When you can see predicted CSAT, effort, and churn risk on every single call, and can filter by agent, topic, or time period, you stop guessing where friction is and start seeing it directly. A high effort score clustered around a specific call reason indicates a process problem worth investigating. A spike in churn risk tied to a particular agent indicates where coaching is needed.
And when you place QA scores and CX scores side by side at the agent level, the disconnects become immediately visible. An agent with a strong QA score and a low predicted CSAT is no longer a mystery. You can see exactly where the experience broke down and coach it directly.
What Fixing It Looks Like: A Real Example
One of our customers, an internet service provider, came to us with two clear problems: CSAT scores were low, and their QA program was covering only 1–5% of interactions — a sample too small to generate any reliable signal about what was actually happening across their operation.
They deployed MiaRec's automated QA to achieve 100% interaction coverage, and paired it with AI-powered CX scoring to track predicted CSAT, effort, and NPS on every call. The scoring gave each agent specific, AI-generated coaching notes tied to real interactions. Rather than waiting for a monthly review cycle, agents were asked to review three to five calls with their coaching feedback each morning before their shift — a low-friction habit that kept improvement continuous.
The results, tracked over ten weeks:
- Predicted CSAT rose from 3.2 to 3.7 — a 16% improvement
- Very dissatisfied call outcomes dropped from 183 to 44 over the same period
- Very satisfied outcomes increased from 96 to 492
- NPS improved by 42%
The measurement didn't drive those results on its own. What drove them was what the measurement made possible: knowing which agents needed coaching on which behaviors, and being able to act on that information at a pace and scale that manual QA could never support.
Conclusion
QA programs exist for a reason. They create accountability, establish standards, and give managers a basis for coaching conversations. None of that goes away.
But if the scores aren't correlating with how your customers actually feel — and for many organizations, the data suggests they aren't — then the program is measuring the wrong things, or not enough of the right things. Green dashboards are only meaningful if they're connected to outcomes that matter.
The good news is that the gap is diagnosable and fixable. Here is a simple place to start: Run a correlation between your QA scores and your available CSAT data. If the relationship is weak or absent, you now know why, and you know where to look next. From there, audit your scorecard question by question and ask honestly: Does this question predict a good customer experience, or does it merely confirm that a process was followed?
The goal isn't a perfect score. It's a contact center where customers consistently leave interactions feeling heard, helped, and satisfied — and where your data actually tells you when that's happening and when it isn't.
Data and research cited from CMP Research's Executive Priorities Study, presented by Jordan Zivoder, Quantitative Research Lead and Analyst at CMP Research.

How Contact Center AI Can Help Reduce Customer Churn

6 Ways To Boost Your Hospitality Contact Center with Generative AI